
This week was based around data gathering, which “is the process of gathering and measuring information on variables of interest, in an established systematic fashion” (Data Collection, n.d.)the important part of this definition in the “Established systematic fashion” bit. Individuals are wildly different, it’s what’s so great about being human. It’s also what can make good data gathering difficult to do. A system of type allows us to gather more data with less user bias.
Reflection on the Topic
The most interesting part of the week for me was triangulation, which is defined as something that “facilitates validation of data through cross verification from more than two sources. It tests the consistency of findings obtained through different instruments” (Triangulation, 2015) So it’s basically a way to verify your findings by using a different method to gather the same data, or to gather different data that means the same thing.
It works sort of like this diagram:
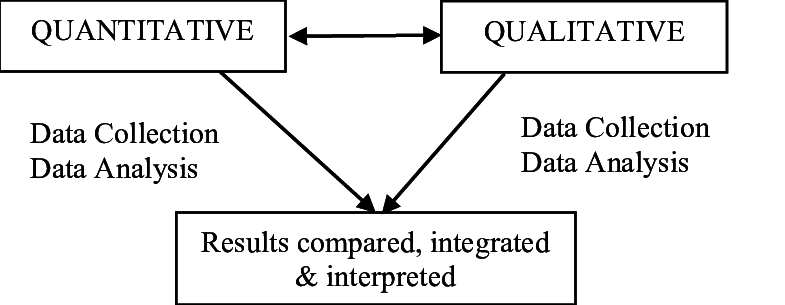
Atif, A. (2013). Triangulation Diagram.
Which is using the method Triangulation of Data. In which data is gathered from different sources, or using different methods (In the pictures case, quantitative and qualitative), which is then used to help find and answer whatever issue the researcher was searching for.
My Thought
“Triangulation is important because it follows a very simple rule that was set in biblical times. Which is that something cannot be proven by just one, but must have to or more witnesses before it’s considered proof. Any method of triangulation is used to do just that, be another witness for proof.” (L.E. Spencer, 2018).
References
Data Collection(n.d.). Retrieved from
https://ori.hhs.gov/education/products/n_illinois_u/datamanagement/dctopic.html
Triangulation(2015, January 15). Retrieved from
https://www.betterevaluation.org/en/evaluation-options/triangulation
Atif, A. (2013, December). Triangulation Diagram. Retrieved from
https://www.researchgate.net/figure/A-Visual-Diagram-of-the-Mixed-Methods-
Concurrent-Triangulation-Strategy-The-researchers_fig1_280860447
